ContourSeries
Note
This section is under construction. Please contribute!
A ContourSeries renders a 2D array of values as contours.
Axes
Data
Tracker
The format string may use the following arguments:
{0}the title of the series{1}the title of the x-axis{2}the x-value{3}the title of the y-axis{4}the y-value{5}the title of the contour level axis{6}the contour level{PropertyX}the value ofPropertyXin the item (extended format string syntax)
To show the contour level with one digit, use the format string "{6:0.0}".
The default format string for ContourSeries is "{0}\n{1}: {2}\n{3}: {4}\n{5}: {6}"
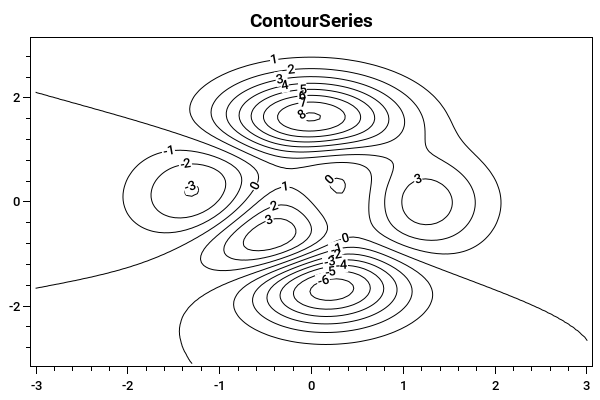
Example
var model = new PlotModel { Title = "ContourSeries" };

double x0 = -3.1;
double x1 = 3.1;
double y0 = -3;
double y1 = 3;

//generate values
Func<double, double, double> peaks = (x, y) => 3 * (1 - x) * (1 - x) * Math.Exp(-(x * x) - (y + 1) * (y + 1)) - 10 * (x / 5 - x * x * x - y * y * y * y * y) * Math.Exp(-x * x - y * y) - 1.0 / 3 * Math.Exp(-(x + 1) * (x + 1) - y * y);
var xx = ArrayBuilder.CreateVector(x0, x1, 100);
var yy = ArrayBuilder.CreateVector(y0, y1, 100);
var peaksData = ArrayBuilder.Evaluate(peaks, xx, yy);

var cs = new ContourSeries
{
        Color = OxyColors.Black,
        LabelBackground = OxyColors.White,
        ColumnCoordinates = yy,
        RowCoordinates = xx,
        Data = peaksData
};
model.Series.Add(cs);