HeatMapSeries
Note
This section is under construction. Please contribute!
A HeatMapSeries shows a 2D array of values as a heat map.
Tracker
The format string may use the following arguments:
{0}the title of the series{1}the title of the x-axis{2}the x-value{3}the title of the y-axis{4}the y-value{5}the title of the value/color-axis{6}the color-value{PropertyX}the value ofPropertyXin the item (extended format string syntax)
To show the x and y values with one digit, use the format string "{2:0.0},{4:0.0}".
The default format string for HeatMapSeries is "{0}\n{1}: {2}\n{3}: {4}\n{5}: {6}"
Example (Linear, Bitmap)
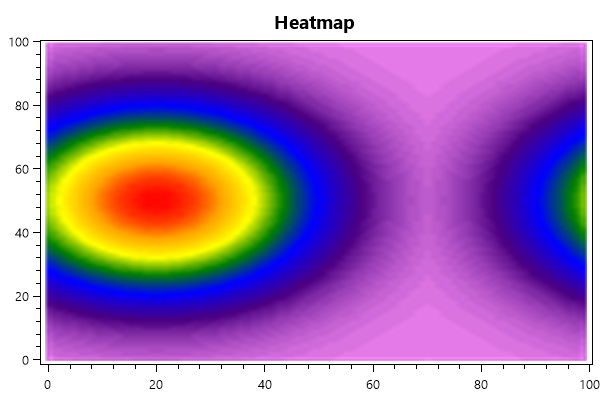
var model = new PlotModel { Title = "Heatmap" };

// Color axis (the X and Y axes are generated automatically)
model.Axes.Add(new LinearColorAxis
{
    Palette = OxyPalettes.Rainbow(100)
});

// generate 1d normal distribution
var singleData = new double[100];
for (int x = 0; x < 100; ++x)
{
    singleData[x] = Math.Exp((-1.0 / 2.0) * Math.Pow(((double)x - 50.0) / 20.0, 2.0));
}

// generate 2d normal distribution
var data = new double[100, 100];
for (int x = 0; x < 100; ++x)
{
    for (int y = 0; y < 100; ++y)
    {
        data[y, x] = singleData[x] * singleData[(y + 30) % 100] * 100;
    }
}

var heatMapSeries = new HeatMapSeries
{
    X0 = 0,
    X1 = 99,
    Y0 = 0,
    Y1 = 99,
    Interpolate = true,
    RenderMethod = HeatMapRenderMethod.Bitmap,
    Data = data
};

model.Series.Add(heatMapSeries);
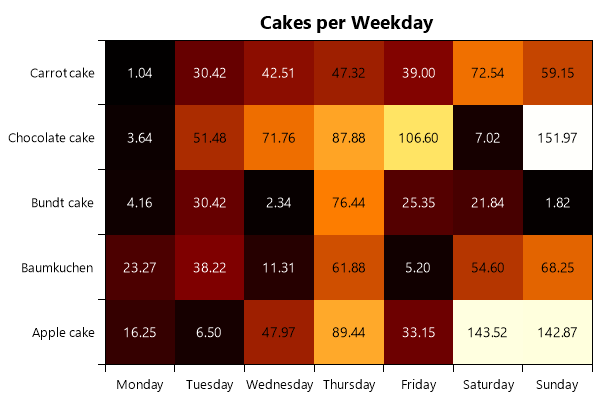
Example (Categorized, Rectangle)
The following diagram has categories on both, the x-axis and the y-axis.
It visualizes the amount of cake (y-axis) consumed on the specific day of week (x-axis). As can be seen in the diagram, the amount of cake rises from Monday to Sunday.
var model = new PlotModel { Title = "Cakes per Weekday" };

// Weekday axis (horizontal)
model.Axes.Add(new CategoryAxis
{
    Position = AxisPosition.Bottom,

    // Key used for specifying this axis in the HeatMapSeries
    Key = "WeekdayAxis",

    // Array of Categories (see above), mapped to one of the coordinates of the 2D-data array
    ItemsSource = new[]
    {
            "Monday",
            "Tuesday",
            "Wednesday",
            "Thursday",
            "Friday",
            "Saturday",
            "Sunday"
    }
});

// Cake type axis (vertical)
model.Axes.Add(new CategoryAxis
{
    Position = AxisPosition.Left,
    Key = "CakeAxis",
    ItemsSource = new[]
    {
            "Apple cake",
            "Baumkuchen",
            "Bundt cake",
            "Chocolate cake",
            "Carrot cake"
    }
});

// Color axis
model.Axes.Add(new LinearColorAxis
{
    Palette = OxyPalettes.Hot(200)
});

var rand = new Random();
var data = new double[7, 5];
for (int x = 0; x < 5; ++x)
{
    for (int y = 0; y < 7; ++y)
    {
        data[y, x] = rand.Next(0, 200) * (0.13 * (y + 1));
    }
}

var heatMapSeries = new HeatMapSeries
{
    X0 = 0,
    X1 = 6,
    Y0 = 0,
    Y1 = 4,
    XAxisKey = "WeekdayAxis",
    YAxisKey = "CakeAxis",
    RenderMethod = HeatMapRenderMethod.Rectangles,
    LabelFontSize = 0.2, // neccessary to display the label
    Data = data
};

model.Series.Add(heatMapSeries);