WPF (XAML)
Note
This section is under construction. Please contribute!
This example shows how to create a WPF application with a Plot control, where the content of the plot (axes, series, annotations) is defined in XAML.
Create project
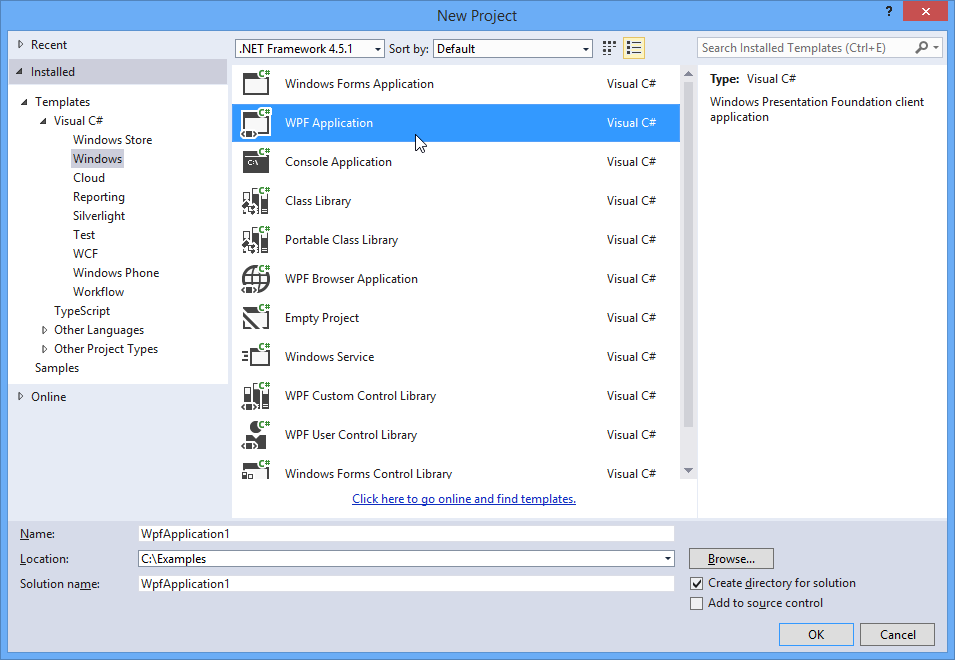
Start Visual Studio and select “FILE -> New -> Project…” to create a new WPF application:
Add references
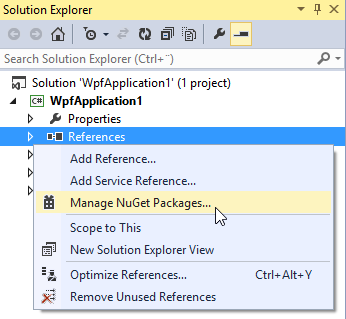
You need references to the OxyPlot and OxyPlot.Wpf assemblies. The easiest way to add these is to right click on the “References” item in the Solution Explorer and select “Manage NuGet Packages…” (this requires that the “NuGet Package Manager” extension is installed):
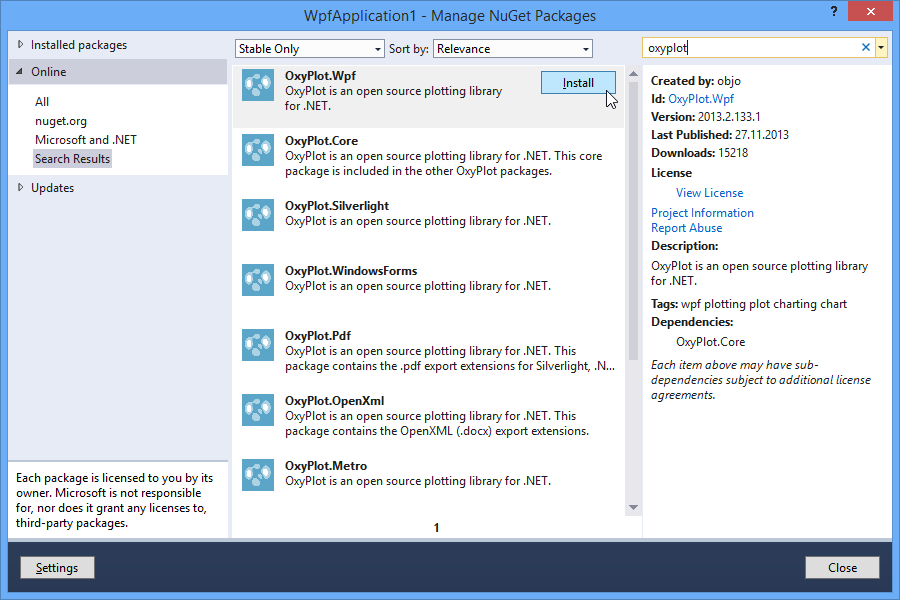
In the “Manage NuGet packages” dialog, search for “OxyPlot” (activate the Include prerelease option) and select the “OxyPlot.Wpf” package:
You can also use the Package Manager Console to install the package:
PM> Install-Package OxyPlot.Wpf -Pre
Create a view model
Then create a class that defines the data to be plotted.
namespace WpfApplication2
{
    using System.Collections.Generic;

    using OxyPlot;

    public class MainViewModel
    {
        public MainViewModel()
        {
            this.Title = "Example 2";
            this.Points = new List<DataPoint>
                              {
                                  new DataPoint(0, 4),
                                  new DataPoint(10, 13),
                                  new DataPoint(20, 15),
                                  new DataPoint(30, 16),
                                  new DataPoint(40, 12),
                                  new DataPoint(50, 12)
                              };
        }

        public string Title { get; private set; }

        public IList<DataPoint> Points { get; private set; }
    }
}
Create the view
Define the namespace in the Window element, set the DataContext and add a Plot control:
<Window x:Class="WpfApplication2.MainWindow"
        xmlns="http://schemas.microsoft.com/winfx/2006/xaml/presentation"
        xmlns:x="http://schemas.microsoft.com/winfx/2006/xaml"
        xmlns:oxy="http://oxyplot.org/wpf"
        xmlns:local="clr-namespace:WpfApplication2"
        Title="Example 2 (WPF)" Height="350" Width="525">
    <Window.DataContext>
        <local:MainViewModel/>
    </Window.DataContext>
    <Grid>
        <oxy:Plot Title="{Binding Title}">
            <oxy:Plot.Series>
                <oxy:LineSeries ItemsSource="{Binding Points}"/>
            </oxy:Plot.Series>
        </oxy:Plot>
    </Grid>
</Window>
If you want to add a Plot control in the design view, press Choose Items... in the Toolbox and browse for the OxyPlot.Wpf.dll file. If you used NuGet, it should be located in the packages folder in your solution folder.
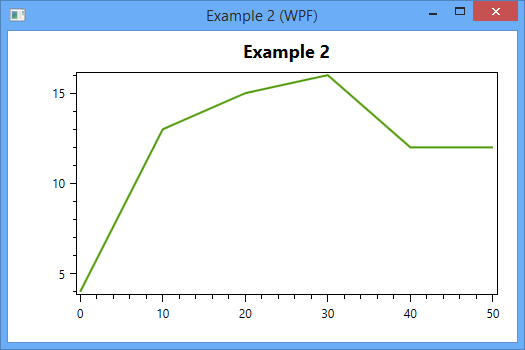
The application should now look like this:
The source code can be found in the HelloWorld\WpfApplication2 folder in the documentation-examples repository.