BarSeries
Note
This section is under construction. Please contribute!
A BarSeries shows the data as horizontal bars.
Axes
A vertical CategoryAxis and a horizontal LinearAxis is required.
Tracker
The format string may use the following arguments:
{0}the title of the series{1}the category{2}the bar value{PropertyX}the value ofPropertyXin the item (extended format string syntax)
To show only the value with one digit, use the format string "{2:0.0}".
If an item was hit, it is also possible to use the extended format string syntax, e.g. {PropertyX:0.##}, where the value of PropertyX will be found by reflection of the item.
The default format string for BarSeries is "{0}\n{1}: {2}"
See MSDN for more information about format strings.
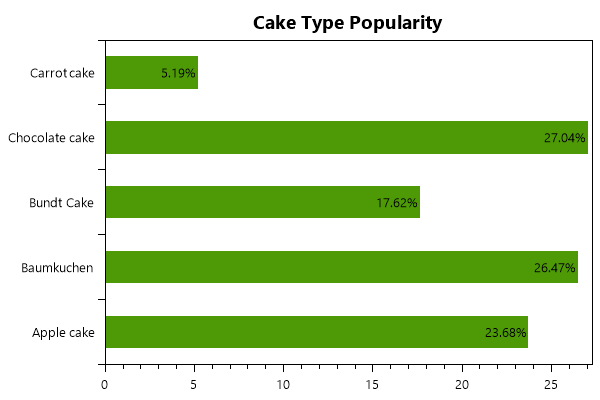
Example(simple)
Here a simple example making use of very basic functionality to visualize the popularity of 5 different types of cake.
var model = new PlotModel{ Title = "Cake Type Popularity" };

//generate a random percentage distribution between the 5
//cake-types (see axis below)
var rand = new Random();
double[] cakePopularity = new double[5];
for(int i = 0; i < 5; ++i) {
        cakePopularity[i] = rand.NextDouble();
}
var sum = cakePopularity.Sum();

var barSeries = new BarSeries
{
        ItemsSource = new List<BarItem>(new[]
        {
                new BarItem{ Value = (cakePopularity[0] / sum * 100) },
                new BarItem{ Value = (cakePopularity[1] / sum * 100) },
                new BarItem{ Value = (cakePopularity[2] / sum * 100) },
                new BarItem{ Value = (cakePopularity[3] / sum * 100) },
                new BarItem{ Value = (cakePopularity[4] / sum * 100) }
        }),
        LabelPlacement = LabelPlacement.Inside,
        LabelFormatString = "{0:.00}%"
};
model.Series.Add(barSeries);

model.Axes.Add(new CategoryAxis
{
        Position = AxisPosition.Left,
        Key = "CakeAxis",
        ItemsSource = new[]
        {
                "Apple cake",
                "Baumkuchen",
                "Bundt Cake",
                "Chocolate cake",
                "Carrot cake"
        }
});
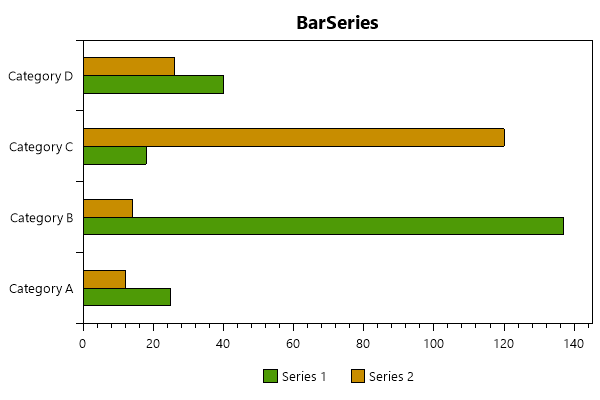
Example(grouped)
Here a more advanced example making use of grouping to always compare the two series’ values.
var model = new PlotModel
{
        Title = "BarSeries",
        LegendPlacement = LegendPlacement.Outside,
        LegendPosition = LegendPosition.BottomCenter,
        LegendOrientation = LegendOrientation.Horizontal,
        LegendBorderThickness = 0
};

var s1 = new BarSeries { Title = "Series 1", StrokeColor = OxyColors.Black, StrokeThickness = 1 };
s1.Items.Add(new BarItem { Value = 25 });
s1.Items.Add(new BarItem { Value = 137 });
s1.Items.Add(new BarItem { Value = 18 });
s1.Items.Add(new BarItem { Value = 40 });

var s2 = new BarSeries { Title = "Series 2", StrokeColor = OxyColors.Black, StrokeThickness = 1 };
s2.Items.Add(new BarItem { Value = 12 });
s2.Items.Add(new BarItem { Value = 14 });
s2.Items.Add(new BarItem { Value = 120 });
s2.Items.Add(new BarItem { Value = 26 });

var categoryAxis = new CategoryAxis { Position = AxisPosition.Left };
categoryAxis.Labels.Add("Category A");
categoryAxis.Labels.Add("Category B");
categoryAxis.Labels.Add("Category C");
categoryAxis.Labels.Add("Category D");
var valueAxis = new LinearAxis { Position = AxisPosition.Bottom, MinimumPadding = 0, MaximumPadding = 0.06, AbsoluteMinimum = 0 };
model.Series.Add(s1);
model.Series.Add(s2);
model.Axes.Add(categoryAxis);
model.Axes.Add(valueAxis);