PieSeries
Note
This section is under construction. Please contribute!
A PieSeries renders a pie chart. Only one pie series is supported per PlotModel.
Tracker
The format string may use the following arguments:
{0}the title of the series{1}the label of the pie slice{2}the value of the pie slice{3}the percentage of the pie slice{PropertyX}the value ofPropertyXin the item (extended format string syntax)
To show the values with one digit, use the format string "{2:0.0}".
The default format string for PieSeries is "{1}: {2:0.###} ({3:P1})"
Labels
The format string may use the following arguments:
{0}the value of the pie slice{1}the label of the pie slice{2}the percentage of the pie slice{PropertyX}the value ofPropertyXin the item (extended format string syntax)
To show the values with one digit, use the format string "{2:0.0}".
The default format string for PieSeries is "{1}: {2:0.###} ({3:P1})"
Example
using OxyPlot;
using OxyPlot.Series;
namespace ExampleLibrary
{
public class PieViewModel
{
private PlotModel modelP1;
public PieViewModel()
{
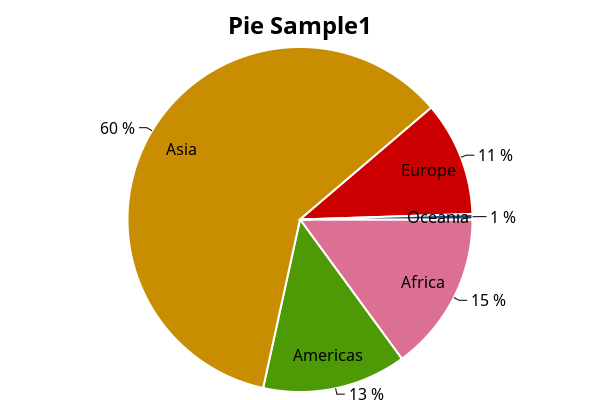
modelP1 = new PlotModel { Title = "Pie Sample1" };
dynamic seriesP1 = new PieSeries { StrokeThickness = 2.0, InsideLabelPosition = 0.8, AngleSpan = 360, StartAngle = 0 };
seriesP1.Slices.Add(new PieSlice("Africa", 1030) { IsExploded = false, Fill = OxyColors.PaleVioletRed });
seriesP1.Slices.Add(new PieSlice("Americas", 929) { IsExploded = true });
seriesP1.Slices.Add(new PieSlice("Asia", 4157) { IsExploded = true });
seriesP1.Slices.Add(new PieSlice("Europe", 739) { IsExploded = true });
seriesP1.Slices.Add(new PieSlice("Oceania", 35) { IsExploded = true });
modelP1.Series.Add(seriesP1);
}
public PlotModel Model1
{
get { return modelP1; }
set { modelP1 = value; }
}
}
}